Customer Feedback Analytics
FeedbackPoster provides customer feedback analytics software for SaaS and product teams to understand feedback trends, prioritize feature requests, and measure product demand. Analyze voting patterns, priorities, statuses, and custom fields to make data-driven roadmap decisions.
What Is Customer Feedback Analytics?
Collecting customer feedback is only the first step. Product teams also need to understand trends, measure progress, and identify the requests that deserve attention.
Customer feedback analytics transform raw feedback into meaningful metrics and visualizations, helping product managers, founders and product teams make faster and better product decisions.
Why Are Customer Feedback Analytics Important?
As feedback grows, simply reading requests one by one becomes increasingly difficult. Teams need a quick overview of product health before deciding what to build next.
Customer feedback dashboards help product teams answer questions such as:
- Is feedback increasing over time?
- Are unresolved high-priority requests accumulating?
- Which boards receive the most customer feedback?
- Which requests receive the most customer votes?
- How is feedback distributed across priorities and statuses?
Instead of manually reviewing hundreds of feedback items, dashboards provide an instant overview that helps product managers identify trends, prioritize work, and monitor progress.
Customer Feedback Analytics Dashboards
FeedbackPoster currently includes several built-in dashboards that provide immediate insight into your customer feedback. New analytics and charts continue to be added over time.
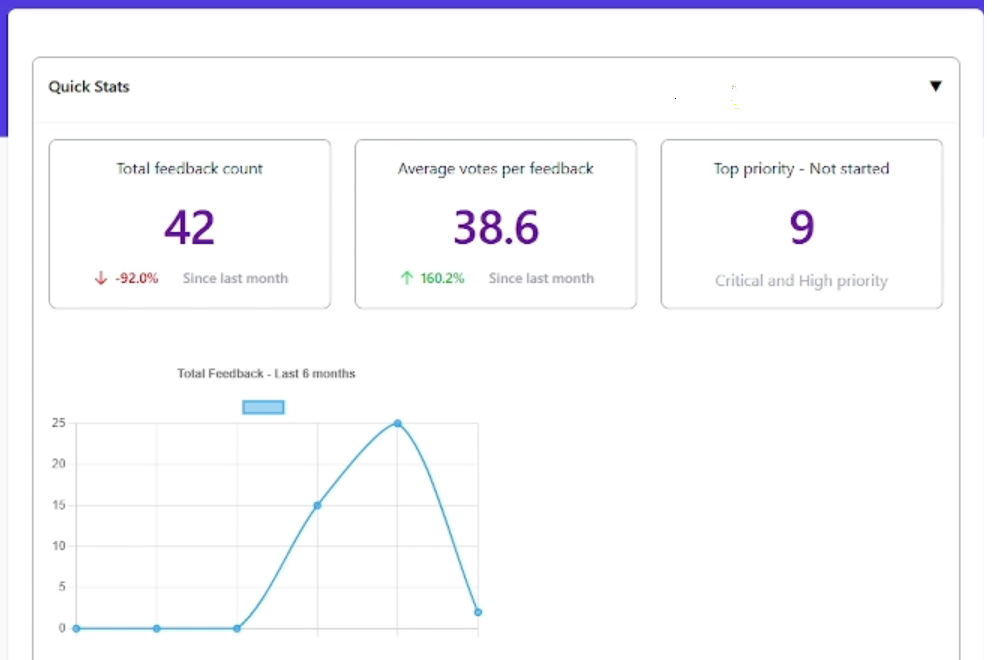
1. Customer Feedback Dashboard
The overview dashboard highlights the most important metrics at a glance, allowing product teams to quickly understand the current state of their feedback.
These metrics help product teams understand whether customer demand is increasing, whether engagement is improving, and whether unresolved requests are accumulating.
2. Status and Priority Analytics
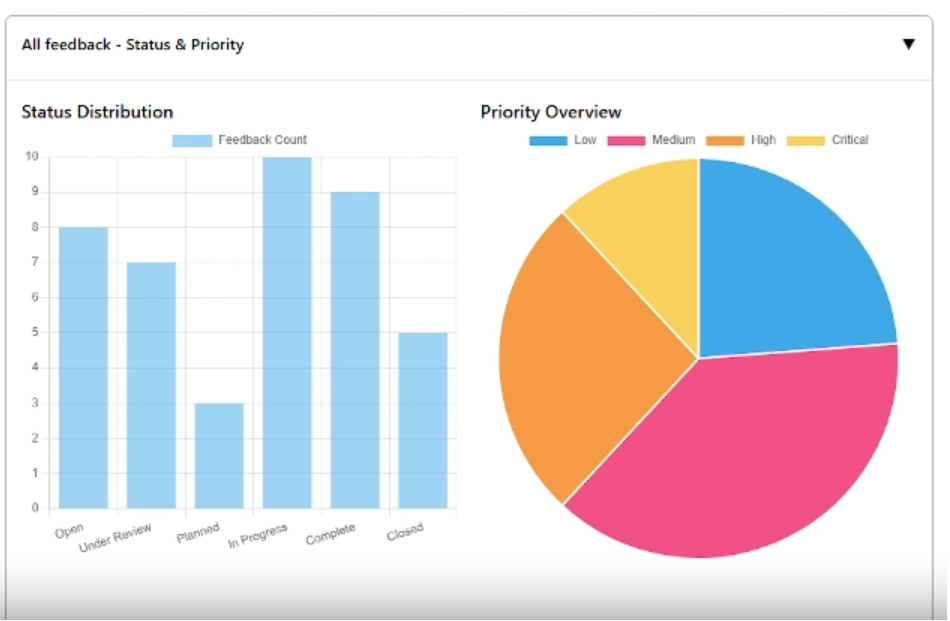
Simple bar charts show how feedback is distributed across statuses and priorities, helping teams understand workload and overall product health.
3. Priority Analysis by Status
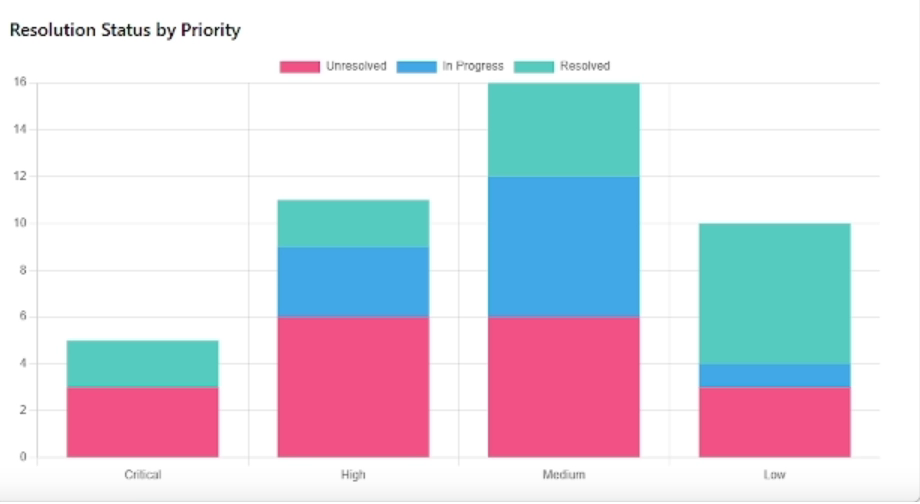
A stacked bar chart combines priority and status into a single visualization, making it easy to identify how many high- or critical-priority requests remain unresolved.
This chart helps teams quickly identify bottlenecks and focus on the work that has the greatest impact.
4. Feedback Board Analytics
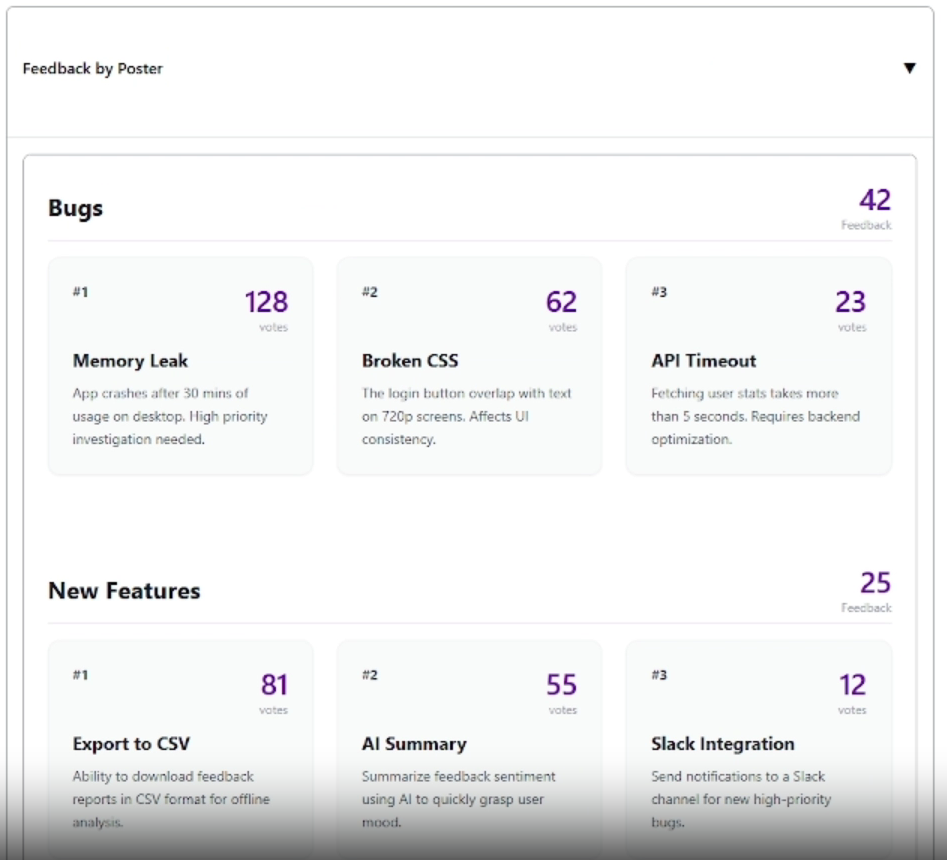
Every board includes a quick summary showing the total number of feedback items together with the three most upvoted requests.
This allows teams managing multiple products or applications to immediately understand which boards are most active and which requests attract the greatest customer interest.
Upcoming Customer Feedback Analytics Features
The dashboards shown above represent the current analytics available in FeedbackPoster. Analytics capabilities continue to expand as new features are added.
Planned additions include charts and visualizations based on custom feedback fields, allowing teams to analyze feedback by business-specific information such as customer tier, browser, product module, department, region, or any administrator-created field.
As FeedbackPoster evolves, the goal is to provide increasingly powerful analytics that help product teams move from collecting feedback to making data-driven product decisions.
Build a Smarter Feedback System
Analytics are most valuable when your feedback is well structured and easy to filter. Combine custom fields with advanced filtering to uncover trends, understand customer needs, and prioritize your roadmap with confidence.
In-app feedback widget
Collect feedback directly inside your product with an in-app widget.
Custom Feedback Fields
Capture structured customer feedback with unlimited custom fields tailored to your product and business.
Advanced Filtering
Quickly segment and search feedback using custom fields, status, priority, boards, and more.