Why Most Feedback Tools Still Leave You Guessing
Why Gathering and Analyzing Feedback in One Place Matters
Collecting feedback is only half the story — the real magic happens when you can understand it. Teams today use feedback to prioritize features, fix pain points, and make strategic product decisions. But there’s a problem: feedback is often scattered across tools, spreadsheets, and dashboards. You collect it in one place but have to analyze it somewhere else — usually by exporting CSVs and tinkering in Excel, Sheets, or Power BI. That workflow breaks momentum and adds unnecessary complexity. Having a single platform that lets you gather, filter, and analyze feedback in one place saves hours and brings insights closer to your decision-making process. The fewer steps between receiving and understanding feedback, the faster your product evolves in the right direction.
The Current State of Feedback Tools
If you look at popular low-cost customer feedback management (CFM) tools — like Feedbear, Frill, FeatureUpvote, and Upvoty — you’ll notice a pattern. These tools do a great job at making it easy to collect votes and comments from users. They’re simple, clean, and affordable. But when it comes to analytics or deeper reporting, they fall short. Most of them provide: Basic filtering (like “most upvoted” or “recently added”) Simple status tracking (e.g., planned, in progress, completed) Limited exports for teams that want to do real analysis elsewhere Sorting by “top votes” might surface the most popular requests, but it doesn’t necessarily tell you why users care about them, how they connect to user segments, or how priorities shift over time. An example of how filtering looks on most tools:
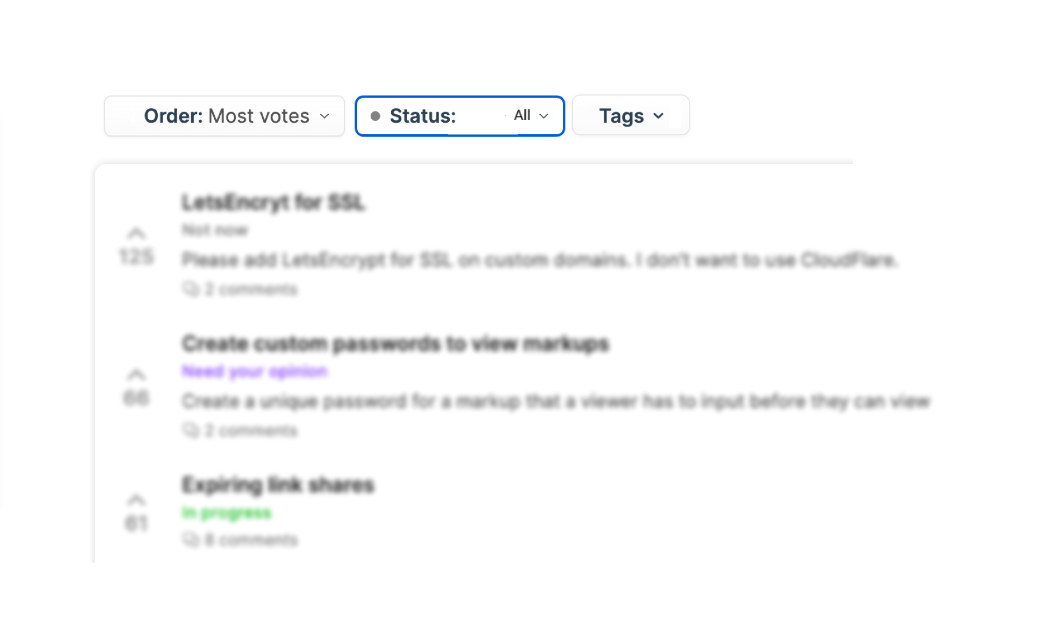
In other words — these tools are great for collecting data, but not great at helping you see the story behind it. For example, here you can't see most voted items per tag, for all tags, at once. A nice reporting visualization would help quickly identify what's happening. In addition, there's no visualizations of reports at all, maybe only very basic ones. Admins have to export data to third-party tool like Google sheets and make manual adjustments to identify trends.
Growing User Trend: Custom Everything
As product teams mature, they expect more flexibility — even from low-cost tools. If you browse through user discussions or feedback boards of these platforms, you’ll see the same recurring themes: “Can we add custom fields?” “Can we create our own reports?” “Can we group feedback by team or segment?” Users want to tailor their data, not just collect it. They’re looking for tools that fit their workflow instead of forcing them into rigid reporting templates. This trend is clear: even small and mid-sized teams now demand customizable feedback management — fields, filters, and analytics that adapt to their context. Indeed, some low-cost CFM tools have recently added some custom fields or started to integrate them.
A Fresh Approach: Feedbackposter
That’s where Feedbackposter comes in. It offers everything you’d expect from an affordable CFM tool — widgets, simplicity, management, voting boards, changelogs, and public roadmaps — but goes further. With custom feedback fields, teams can capture exactly what matters to them (like user type, subscription level, or impact score). And with built-in reporting and visualizations, they can analyze trends, identify key patterns, and make data-driven decisions — all without leaving the app. No more exporting. No more juggling spreadsheets. Just actionable insights, right where your feedback lives. If you believe feedback should be more than a pile of upvotes, Feedbackposter is built for you — collect, manage, and understand feedback in one powerful place..
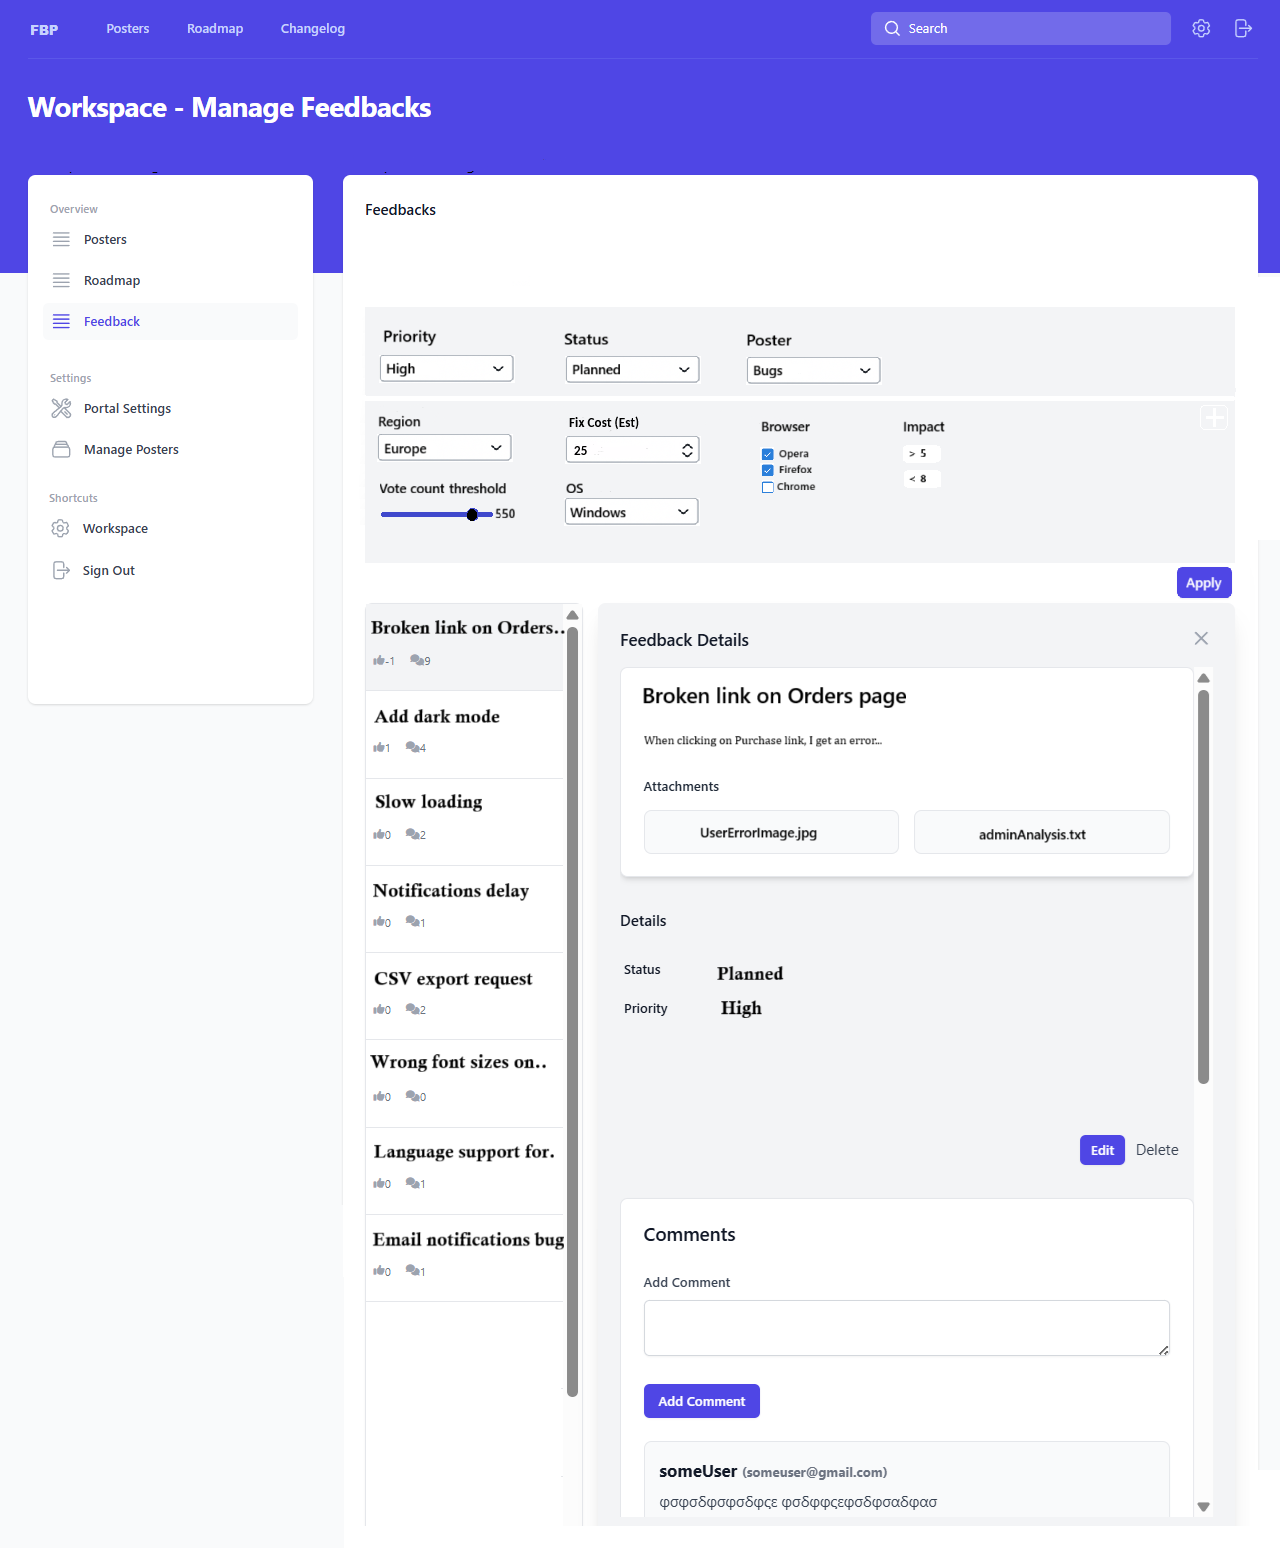
The basic fields like Priority, Status and Poster are included in filtering, as well as your custom feedback fields, like Region, Fix Cost, Browser, OS, anything. Filtering on all these gives a clearer picture and helps admins locate and edit desired feedbacks.
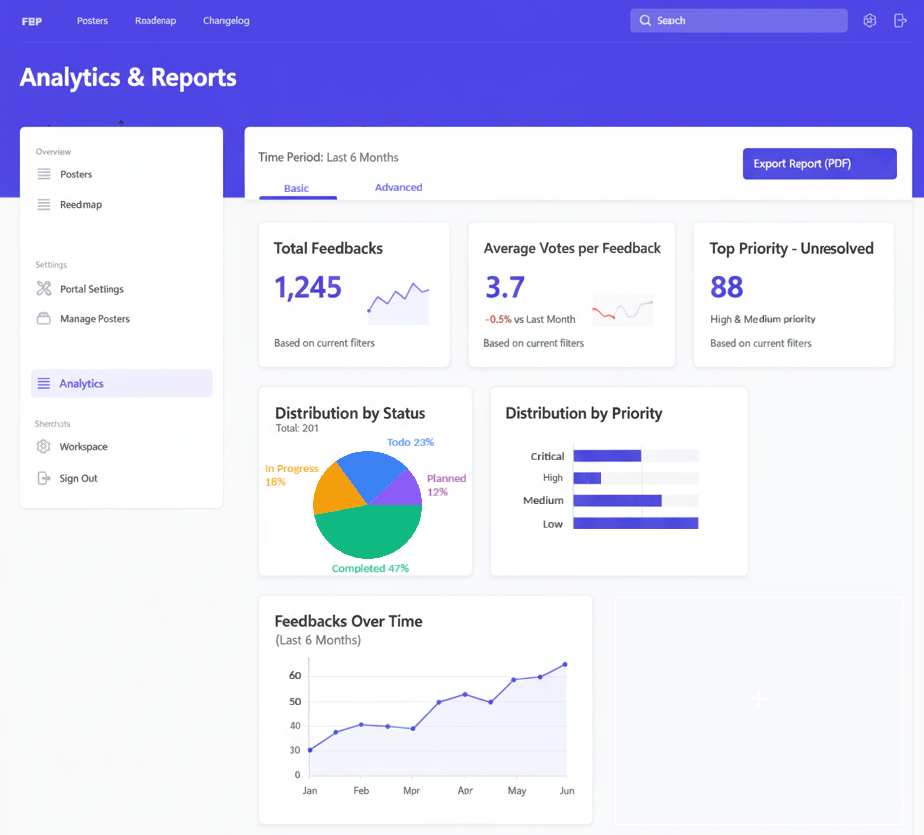
Screenshot speaks by itself, Analytics page provides quick overview of all your feedback divided by basic factors, like total feedback count, average votes per feedback and most prioritized items that are still not done. Bar and pie charts can also visually brief about the percentage of feedback items per status or priority.
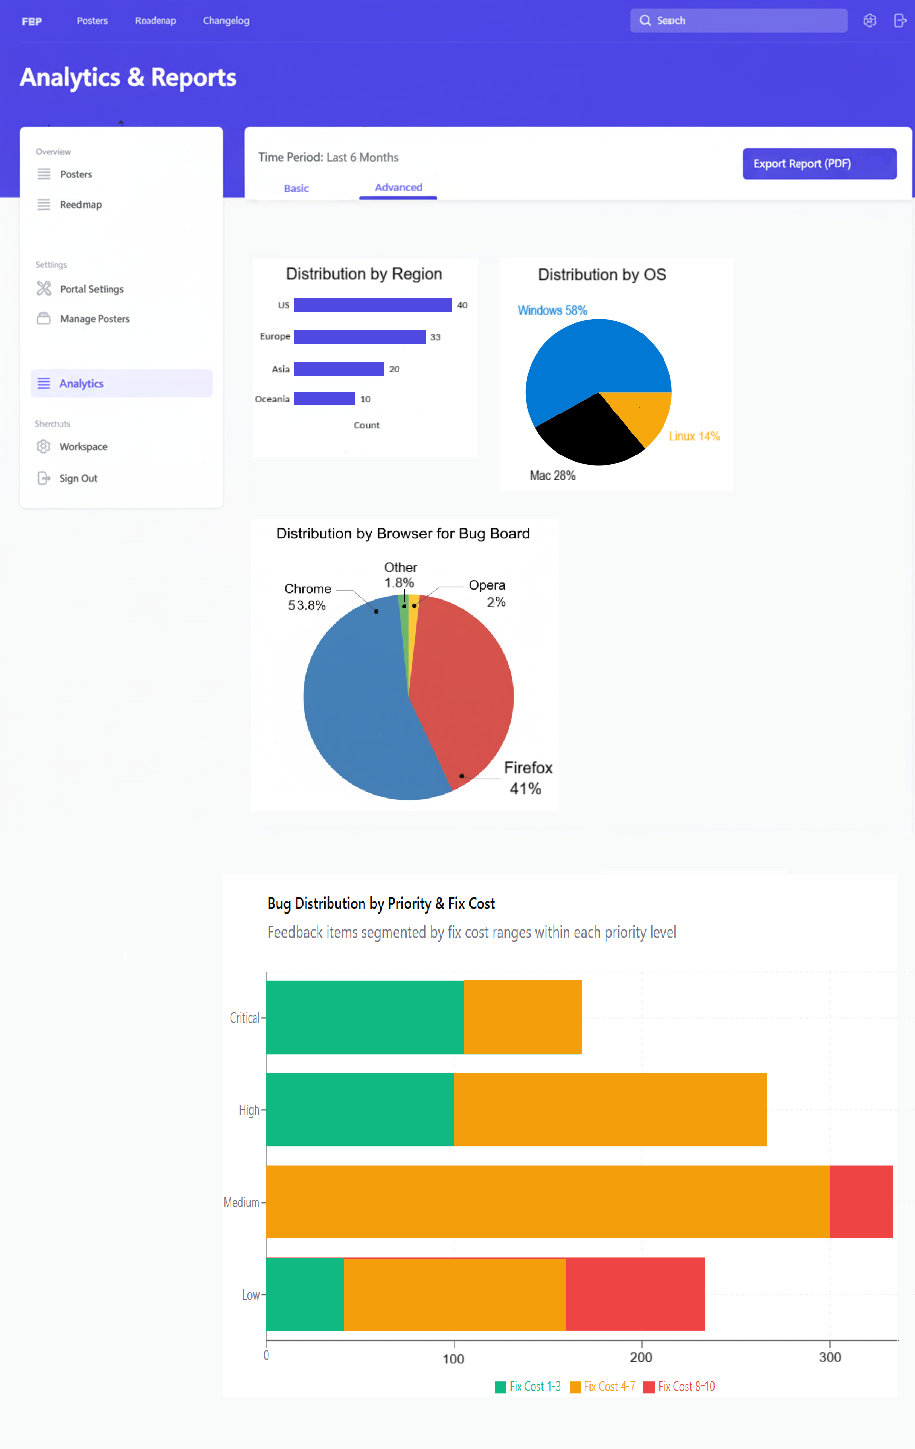
In advanced Analytics section, admins can check feedback by their custom fields that make sense for your business. Combined reporting, for example Bug Poster and custom field Browser, can provide great insight about which browser has most bugs. Multi-factor reporting that contains Bug Poster, Priority and Fix cost custom fields, can help realize which important fixes are quick wins and which fixes aren't worth the effort and cost.